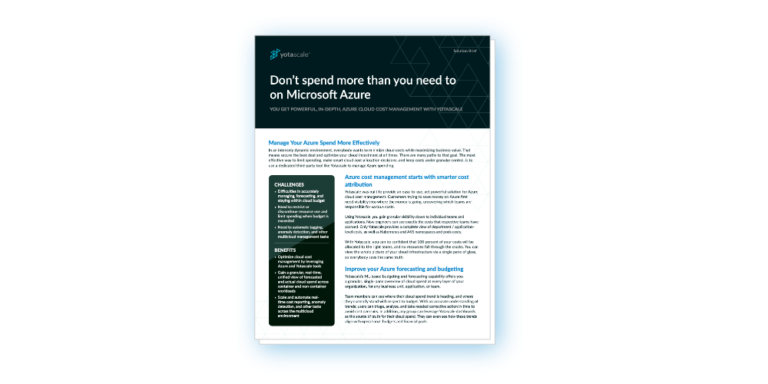
See what automated cloud cost management really looks like, and what it can do for your business, fast. In this webinar, we cover these key areas of impact:
-
- Tagging and allocation
- Budgeting and forecasting
- Optimization and anomaly detection
Length: 48 minutes
—
Webinar Transcript
- Introduction
- Meet the Presenters
- Splitting Costs by Business Units, Teams, and Applications
- Automating Delivery of Reports to the Right People
- Automating Tagging When CUR File Tags Aren’t That Good
- Identifying and Filtering Untagged Assets
- Correctly Formatting Tags
- Getting Notified Right Away When There is a Jump In Cost
- Can I See Recommendations Just for My Application?
- Forecasting and Budgeting for Engineering Managers
- Viewing Breakdown of AWS Cost by Service Items
- Cost Visibility for All Kubernetes Flavors
- Relevant and Responsive Recommendations and Alerts
- Role Based Access to Cost Data
Introduction
Susan Brandes:
Hi everybody. Thanks for joining us. We are here today to talk about a topic that we at Yotascale hold very near and dear to our hearts, and that is automation, specifically automation and cloud cost management.
We decided to hold this session after attending the FinOps Foundation monthly meeting. Ashley is here today from FinOps, so welcome, Ashley. It was a great session. The topic of that meeting was all about automation. The automation working group showed all the fabulous research they’re doing. There was a lot of great discussion, tons of questions from the community. Afterwards, we walked away thinking there are still a lot of organizations out there that don’t necessarily know what a third-party cloud cost management product can do in terms of automating all the processes that go into cloud cost management.
Maybe you’re using the cloud native tools and they’re limited, or maybe you’re doing some things manually even, like from tagging and allocation to the way you track down cost anomalies or spikes, things like that. So, we just figured, hey, let’s have a quick session and show people what’s possible, let you ask questions. The more automated your process is, the more time you save, the more money you save, the more resources you can save.
Yotascale was founded by Asim Razzaq, who’s our CEO. He was a platform engineer leader at PayPal and eBay. The reason he founded Yotascale was exactly this problem. He found that a lot of the promise of cloud computing was negated by its complexity. It prevented people from adopting it, delayed migrations, and for those who did adopt, they found that costs quickly grew out of control. That is where Yotascale came about, and now we just wanted to share what’s the latest in cloud cost management automation and go from there.
Meet the Presenters
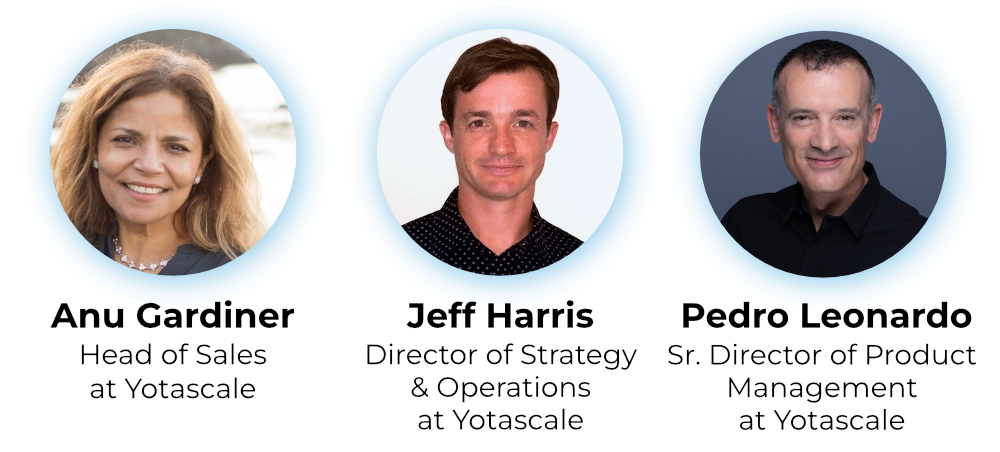
I would like to introduce our main speakers today. Jeff Harris, he’s head of customer success at Yotascale. He’s going to be showing us the product and going through some of the capabilities of automation. Anu Gardiner is our head of sales. She’s going to help lead the discussion. Please feel free to type a question in the chat at any time. We also have Pedro. Is Pedro on? Oh, there you are, Pedro. OK, hi Pedro. Pedro is our director of product management and he’s here to help answer questions as well. I think I’m going to let Anu take it from here.
Anu Gardiner:
Alright. Well, thank you Susan for that overview. Hopefully, everyone here will leave with a better understanding of how much automation is possible. As we all know, platform engineering, DevOps, the whole space—you have a lot of responsibilities. The more we can take off your plate and automate in a way that you trust, the better off you are in general.
So, that’s a great introduction. Maybe I’ll say a little bit about my own journey and how I ended up at Yotascale. I’ve been in the Valley for 20 plus years, which means that I got here just as the dot-com bubble was bursting. So I have the scars to prove that. But there have also been highlights, like scaling DocuSign from 400 employees to 4000 employees. I’m very privileged today to be part of the team at Yotascale as we help companies like Zoom, like Hulu, put their arms around this growing beast called cloud cost. It’s a many-tentacled beast and has many dimensions to it. If you, like me, are a problem solver, this is as exciting as it gets. So, very, very happy to be here.
Jeff, do you want to share a little bit about your journey?
Jeff Harris:
Sure. Yeah. Thanks, Anu. If you don’t know me, my name is Jeff Harris, director of customer success here at Yotascale. I’ve been with the company and working on this problem for the last five years. But even before Yotascale, I spent some time in cloud infrastructure virtualization both at VMware and also as part of Google Cloud. Just before Yotascale, when I was at Google Cloud, I was working with a lot of AWS customers who were struggling with understanding their AWS bill. Around that time, Asim had reached out and was starting this company, having just raised some seed funding. I said, “Yeah, I’m talking to tons of people about that problem, so let’s see if we can build something.”
We’ve been here working on this for the last five years, working with a lot of our different customers, trying to understand the problem as it’s evolved over the last five years to where we are today. I think we started off doing anomaly detection, then we got into more container cost management, and now we’re looking at the multi-cloud aspect of this. As these companies have evolved and matured in the space, we’ve tried to move the product along with them.
Anu Gardiner:
Perfect, Pedro.
Pedro Leonardo:
Yes, so I’m here. My name is Pedro Leonardo, and I’m the director of product at Yotascale. I’ve worked with both startups and large enterprises. I spent many years at Cisco working on their enterprise product in security and analytics. I’ve also worked in a variety of startups as well. I’m very happy to be here at Yotascale, helping companies get a better understanding of their costs and to be more, let’s say, profitable and sustainable.
How do you move into a future where you know what’s happening, have the right information, and make the right decisions? For us, it’s all about helping people improve their business’s bottom line. This is what we are here to do.
Splitting Costs by Business Units, Teams, and Applications
Anu Gardiner:
Great. Thank you, Pedro. So I guess with that, let’s get into the meat of the discussion today. We thought it might be helpful to hear the kinds of questions that we encounter every day as we go to market with this offering called Yotascale.
So while Jeff is pulling up the product, and I think, Susan, we will have plenty of time for Q&A. Is that right? Excellent. As Jeff is pulling up the demo, we thought a helpful structure would be discussing the types of questions we get asked.
I’m going to pretend to be the VP of Platform Engineering at a company that is Series D. We’ve raised a lot of funding, had some success with our product, and now we are growing very fast. With that, our cloud cost is growing quarter on quarter. I would like to see my cost split by the way we are organized. We have business units, teams, applications, and I have a desire to view my huge cloud cost bill, which is growing, through this lens. I want to share it with my colleagues and drive data-based discussions on new features in the product or identify dev teams that need help.
So Jeff, that is my problem. How can you help me?
Jeff Harris:
Yeah. So you mentioned you’re the VP of Platform Engineering. You’ve built this platform for your engineers to use, maybe built on AWS right now. Unfortunately, what usually ends up falling to you as a side responsibility is the responsibility of reporting on cost. Fortunately or not, you have more purview over what’s being used and how it’s being used. This is a common question we start with when we talk to our customers.
Where we begin is by looking at the different attributes you mentioned. In our example here, we’re looking at a company called Acme Tech. They think of the world more as a traditional enterprise with business units, teams, and each of those teams being responsible for a set of services or applications.
So, what does the end result look like for somebody who has this type of question? We can aggregate cost at any of these levels. I can quickly navigate and say, “Hey, I want to understand how much our data business unit is costing us.” I can flip over here, get high-level information about what we’ve spent so far this month, and compare trends to the previous month.
We always have the ability to do much more exploration as well. I can go into analytics, where you can do more exploratory analysis. For instance, if I want to understand the cost of our teams over the last six months, I can come in, edit my graphs, and see how much we’ve been spending over time, either on a month-over-month basis or at an application, environment, or team level.
All of these reports can also be exported and queried by API. When we talk about automation, if there’s something common that you need to pull data from—whether to stitch it into another system or just get an email report on a weekly or monthly basis—we have the ability to set that up as well for any of these views or reports for teams.
Anu Gardiner:
Great, great. So this would be the split by each of the teams. How do you see your other customers taking this data and driving the kind of discussions that they need?
Jeff Harris:
Yeah, I mean, one of the… Go ahead. Sorry, Anu…
Anu Gardiner:
Could you speak to that a little bit?
Automating Delivery of Reports to the Right People
Jeff Harris:
Yeah. And I think what we’ve seen as a really good pattern for implementing and using this data is to not just keep it with that VP of Engineering who has to generate reports or somebody on his team. But how do we automate the delivery of this information? How do we get it to the right people?
We can actually connect each of these concepts here, so it could be at a business unit level, a team level, or more granular if needed. It could be Slack, an email distribution list, a Teams channel, or whatever messaging notification system you’re using. The intent here is that once you’ve defined these objects, we can get into the details of how that’s defined. But just assume we can figure out how to get it to this level, and then we can tie each of those concepts—teams, product services, business units—to a messaging channel. This way, we can push the information out to them, providing regular monthly reports, weekly reports, etc. Does that address the problem you’re hearing commonly?
Anu Gardiner:
Certainly, certainly. I think Bhavik asked a question about how about daily. How many days visible?
Jeff Harris:
So, how many days visible? Right now, you can see as I switched over to the last three months cost view, I switched into a monthly view, but we can absolutely switch over to daily cost views and see this as well. In terms of how much data is available, we can go back as long as you have cost and usage reports. We don’t limit the amount of time that we have data available for our customers.
We have some customers going back to 2019 cost data even at this point. As long as you have that data, we can pull it in. Typically, that gets written to the cost and usage report, and we look for that data history to exist. We can’t necessarily recreate it, but as long as those files are there, we can read them and process them.
Automating Tagging When CUR File Tags Aren’t That Good
Anu Gardiner:
Right, right. So the other problem we have, again, as that Series D startup stage that we are in, is there’s a lot of people getting hired. Our tagging used to be really good a couple of years ago, but now as time has gone by, we find that we don’t really have that tag discipline. So if you’re taking information from our CUR file and the tags are not good, how would we get here? What does that path look like?
Jeff Harris:
Yeah, great question. Obviously, something we hear a lot. It’s a very common concern for companies, even if they haven’t had a good tagging policy in place. Often, we’re working with companies who are just saying, “Wow, costs have gotten expensive. We need to start tracking this at a different level of granularity.”
So, we meet people where they are in terms of tag data, and we’ve got a few different ways that we approach this. One thing that’s kind of unique to our product is our tag management system. The first step is tracking what costs are not being allocated. We actually do have this concept of unallocated costs. Within this hierarchy, every single cent on your bill is allocated somewhere once and only once. Everything is counted one time. That’s really important as a principle for Yotascale because we want to make sure that the cost that is not falling into your predefined categories is being accounted for somewhere.
We actually want to draw attention to this as well, especially if it’s a large number. So we can look at our unallocated costs and see what is driving this. Are there tags on these that we haven’t created rules for? Do we have new applications that we haven’t accounted for yet? We have some automation that can generate or automatically create new contexts. We also see some of our customers using APIs to keep the hierarchy up-to-date so that when we do have tags, we’re accounting for them and able to allocate them.
Additionally, we can drill down to what services these unallocated costs are coming from. For example, we can see if we have a lot of EC2 costs. The next question is often, “What are those EC2 costs? Are they instances or EBS volumes?” We can see that there are quite a few storage volumes out here that are not being allocated. As I go into my cost line item, moving into a more granular report at the resource level, I’m able to get down to what resources don’t have tags. I can see the volume ID, the actual name, and any other tags that are on them.
But right now, what we’re missing is a tag that allows us to allocate it based on this hierarchy. So, as I switch from the report view and analysis view to where I can do something about these unallocated EBS volumes, I’m able to come over to my tag management console. I can see how we are doing on our tagging. We’re actually doing pretty well at Acme Tech, but the tags we require here to do our allocation, such as team and system ID, are missing in some resources.
As we drill into some of these untagged resources, specifically the EBS volumes, I can see these volumes that don’t have tags. In some cases, just as an example here, we can actually identify the parent EC2 instance and the tags on that instance, and we can inherit the tags down to the EBS volume. This is minimal work. Often, we see EC2 instances get tags while the EBS volume attached to them does not, preventing cost allocation. Here, we can quickly identify this relationship and pull the tags down to the EBS volume. This actually writes tags back to AWS, ensuring your source of truth remains the resource itself. Then we can allocate those costs.
One more thing before we move on: I can create an auto-tagging rule that says anytime I see an untagged EBS volume, go ahead and apply the inheritance from the parent policy. This way, I no longer have to worry about those. There are certainly other ways we can use the auto-tagging capability, but this is a common use case where EBS volumes don’t get tagged.
Anu Gardiner:
I think this would be really helpful for our situation. Do you find that your existing customers do this exercise on a regular basis, or do they do it when they see the volume of untagged costs going up? I’m just curious what the best practice is.
Jeff Harris:
There’s, I mean, ongoing pruning is always a good practice to have. Now if you can somehow avoid the pruning and everything just works, that’s fantastic as well. But yes, it looks like we do have a question here. Raise hand. Please go ahead and unmute yourself and ask your question.
Identifying and Filtering Untagged Assets
Audience Member:
So on the same topic like you said, it’s got reflected back at the CSP level. In that sense, how often does it do that? How often do you execute these particular rules for the untagged EBS? And can we further break it down at the attached, non-attached, or filter it on those untagged assets?
Jeff Harris:
Yeah. So, a couple of questions there. One is, how often does this happen? The policies run approximately once an hour. We query the active inventory, pull down what’s there, and then write tags back based on the rules that are available. You can always come in and manually tag things as well through the system. And it doesn’t have to just be EBS volumes. I think the other question was about best practices, is that correct? How often to tag or how to…?
Audience Member:
No, on the same topic for the EBS. Where were you going about the untagged asset at the EBS level and the associated instances? Do we have further breakdown on that view where those EBS were attached, unattached, or just sitting there?
Jeff Harris:
We do. There are a couple of places where that will show up. One is we can see that some of these EBS volumes do not have a parent, which shows that they’re unattached. If we go into some of the utilization analytics, we can also identify unattached EBS volumes there versus attached, where we do know that they’re attached. When we do see that parent ID here though…
Audience Member:
I see, okay. Thanks.
Correctly Formatting Tags
Jeff Harris:
Yeah, and the inherit-from-parent will only work when the parent exists. But yeah, good question. Thank you.
So, Anu, I think taking it back to the tagging piece, this was really about identifying and remediating unallocated tags. There’s another piece where a tag might exist but it’s not in the correct format. Maybe the tag key is different than the key that I’ve made my rules for, and that can be a problem with some role-based systems as there can be a lot of rigidity around it. We try to address that piece of the tagging issue by allowing users to map in so that administrators of the product can map in multiple attributes.
What we’re looking at here is a list of all the keys coming from the cloud provider, in this case, AWS. We can see this is a very common problem where we have a capital “Environment” and lowercase “environment,” and this can happen with many, many different tags. We see it with “team” as well. One of the benefits is we can take those two different tag keys and group them together into an environment category within Yotascale that we can then reference. So, first of all, normalizing the tag keys.
The second piece is we can identify where the format or the values within the key don’t meet the policy we have. Whether there are underscores, dashes, or spaces that we don’t want, we can identify those. Then, tying that together, we can even clean up the tag values and normalize the values in those tag keys before we do the allocation. Specifically, this can involve removing non-alphanumeric characters so that we don’t have confusion between dashes, underscores, and spaces, as well as lowercasing everything to avoid confusion between uppercase and lowercase letters.
This helps clean up a good percentage—really about 80-90%—of the mess. There may still be some pieces where there are misspellings or other issues that we could identify through the tagging module and help remediate there. So, we try to come at it from multiple angles. First, making sense of the data that’s out there, and then helping you get that data cleaned up.
Anu Gardiner:
Right, right. And one of the questions that—stepping out of my role, I’m no longer the VP at this Series D startup, I’m back to my role at Yotascale—one of the questions, Jeff, that we get is how is this different from tools that sort of lead with reports? Would it be fair to say that tools that lead with reports need to have all of the information in their tags to be clean before it can be sliced and diced, whereas here you can do this on an ongoing basis, you called it pruning, on an ongoing basis? Would that be a fair statement?
Jeff Harris:
Yeah, that’s very fair. I think that often reports are going to be—you’d write a SQL query to generate a report, or if you’ve got a BI tool, you might do it that way. However, the grouping of these different values and the different keys can get complex or get missed when you’re doing it that way. You know, somebody tells you in DevOps that, “Hey, we’re using the application tag. Go give me a report based on that application tag,” but then the application tag has a bunch of mess in it. We see things with different cases, different formats, and they don’t match.
Is VIX and VIX 2S3 exporters supposed to be combined together or not, right? So we need somebody centrally to define what these applications are. In the best cases, when we see this really automated, what’s happening with our customers is they have a source of truth already, and they can push that source of truth to Yotascale to build the hierarchy, to build the definition of this, so we can then represent that and keep it updated on a regular basis. A new application gets deployed, we call an API to Yotascale, and we create a new context to track the cost of that application.
That sort of automation allows us to keep the system up to date, so we don’t end up with a bunch of unallocated costs. It also avoids the issue of reports being a very manual process. It’s a human-driven process. If a change happens to the tags, if a new application is released, a human needs to go update the reports to reflect that.
Anu Gardiner:
Right, right. Super. Any other questions on the allocation and tagging and the level of automation before we move on to our next topic of alerts and recommendations?
Audience Member:
I do have a question about the merge that you are showing us about the environment. Is it at the Yotascale level or would it reflect back as well?
Jeff Harris:
That’s a good question. In this case, it is at the Yotascale level. The way that you can actually make that change is if I were to go over to tagging and identify all the lowercase environments—very quickly, I can show what that looks like. It’s not very difficult. Just do environment and we want to find one that is not null. If I spelled it right, we find all those guys with lowercase environment, select them all. We can see there are several hundred resources here that we would be getting, and we would just change that tag key to capital Environment. So this would reflect back to AWS. This is more of writing back the tag from the tagging module versus making sense and reading the data and doing what you need to there.
Audience Member:
Alright, so it will reflect back to the CSP, in this case, AWS or any other provider. How about the policy that you were showing us about the value that certain values you define for the environment? Is it getting it from the config or…?
Jeff Harris:
That is actually a manual input. This would be a regex policy that you can define. We can see in this case, it’s all alphanumeric, lowercase, alpha, numeric characters, and dashes. That’s the format we want system ID to come in, whereas in the environment, we’re looking at very specific string values that we expect to see in that tag value. So any regex policy would work here.
Audience Member:
So this is at the tool level. How about if I already defined it at the config level, AWS Config? Will I see it here about the compliance, non-compliance policies?
Jeff Harris:
No, not today. I don’t think we’re reading from Config as a source today.
Audience Member:
OK, no problem.
Getting Notified Right Away When There is a Jump In Cost
Anu Gardiner:
You bet. You bet. Bhavik, we can schedule a separate session to dig into this a little more, but thank you for the question.
So moving on to the ability to send alerts when needed and also recommendations, which is something we get a lot of questions on. Let me play the role of an engineer. I am four levels deep in an organization in a large public company, and I needed to configure a NAT gateway. It was a long day, we had a lot of things to do, and it turned out that I misconfigured something without intending to. A week later, when we received the monthly report, it turned out that it cost us $40,000 in a day. Obviously, not good. It was a mistake, but my question is, as this engineer, a mistake like this can happen. Could I get notified that there was a jump in cost like that right away?
Jeff Harris:
Yeah, yeah. As soon as we get that cost data and we see that it doesn’t match a pattern, that’s where we actually see some alerts here. This would fall into the category of anomaly detection. Often, what people are doing today is going to cost analytics and checking it on a daily basis.
The purpose of anomaly detection, especially the way Yotascale is built, is that you don’t have to tell us anything. Once you’ve given us this hierarchy, we will automatically look at the cost history for each of these categories and generate a predictive model that allows us to determine if cost has spiked in any way.
Right now, I’m looking at EC2 instances at the company level, but one of the nice things about the hierarchy is that once we put this in place, if I’m an engineer on the consumer app team, for example, I will see anomalies just for my team. I can make this my homepage, and even as an administrator, I can say, “Hey, the API team only gets access to where they’re at.” These notifications are automatically generated as needed whenever something comes up and will be delivered either via email or Slack.
Here, we can see that the cost for a particular application has increased. We see the pattern and can get down to the details. In your case, you would see a NAT gateway listed here and how much that NAT gateway cost. In this particular anomaly, we’re looking at an EC2 anomaly, so we actually get down to the resource IDs as well as the tags that were on these resources, which can be helpful and provide additional context to the engineer receiving this notification. That’s the intent.
Can I See Recommendations Just for My Application?
Anu Gardiner:
Great, great. So we could have saved ourselves a week’s worth of that mistake if we got the alert and acted on it. Which actually brings me to another topic. I’m still that engineer, four levels deep in this large public company. We get sent a report on a monthly basis where we can find our application and our resources, and there are some recommendations, perhaps based on utilization, that we could swap out one machine for another.
My problem, though, is I have a lot of things to worry about, and this is a 40-page report. I cannot wade through this report to find out exactly what applies to me. Even if we did it six months ago, we did a big drive, everyone got together and everyone looked at the report. But on a monthly basis, that’s a tall order. So again, my question is, can I see recommendations just for my application?
Jeff Harris:
Yes, that’s also one of the benefits of the approach we’ve taken with this hierarchy. We have information about where things should be allocated, and we leverage this not just for analytics, not just for budget and forecasting, but also for recommendations.
So right now, coming back to the same persona here, I’m that engineer on the API team. I can see the recommendations available for my particular team. As I drill into these, I’m going to land on a list, and it’s not just that these are for my team, but now I’m actually breaking these down into different applications that my team is running, different services.
So here, if I think about how to get the list of recommendations, we’re sorting and organizing these for you so that you can make more sense of it. That’s the first step. The other problem you run into with a list sent every month or checking trusted advisor once a month is you may have recommendations in there that you’ve already reviewed. The cloud provider or system still sees it as a waste and a potential opportunity to optimize, but there’s a business reason why you have that database out there, or why you chose to keep those M5 extra larges or whatever instance types you’re using.
Any context that a system doesn’t have, we do want to get information back from those edges. This is another area where your Excel spreadsheet, your email, or just checking trusted advisor fails, and Yotascale can be helpful. I can come in and say, “These DVR5 4X larges, we are not going to terminate them. They’re there for a reason,” and I’m going to dismiss this recommendation.
It doesn’t get lost; we keep it in a separate queue, but it doesn’t get counted as something that is a viable option for you and your team. So when you come back to the system, you see a list of things that either you have not reviewed yet or that are viable recommendations.
Anu Gardiner:
Great, great. I think that would be helpful and…
Susan Brandes:
And there was a question from Bhavik about how soon you can get these alerts after the actual event in AWS.
Jeff Harris:
Yeah. So if we’re talking about anomaly detection in those cases, we’re typically about 24 hours from the time that the resource is turned on. We do need some amount of cost data to be able to say, “Hey, this is not matching the pattern at a certain point,” but it’s about 24 hours.
Audience Member:
OK. And on this topic, the recommendation, let’s say it’s completely on CloudWatch, all the metrics, you’re probably pulling it out. But how about if I have a different APM to monitor my disk and memory, is there an integration that I have to do to get the actual recommendation?
Jeff Harris:
Yeah, there is actually. So typically you’re right, CloudWatch is the standard data source. We can connect into the AWS APIs really easily, but we absolutely have customers that are using an APM tool like Datadog. Today, we don’t have a direct connection to it, but what we do is have the data written to an S3 file in a specific format, and we can read that for memory and disk data like you mentioned, if it’s not already in CloudWatch. If it is, we’ll just pull it from there.
Audience Member:
OK. Alright, cool. And does that same thing apply for any ECS or EKS?
Jeff Harris:
So when we talk about ECS and EKS, the way that we pull that data in—this is kind of going towards more of our container cost use case—we do pull the utilization metrics at the container level as well, and we can use those to do cost allocation. So a little bit of another tangent to the allocation story would be that we can use the metrics produced by the pods to do a more granular cost allocation. We basically assign a cost to a pod based on the node it ran on, how much that node cost, and how much capacity it was using within the cluster.
With those metrics, we can either pull from CloudWatch Container Insights, we can also pull from a Prometheus data store if they’re written there, and then if you have them in another place, we can talk offline and see if they should be able to pull those in similarly to the other metrics as well.
Forecasting and Budgeting for Engineering Managers
Anu Gardiner:
Excellent. I’m getting a ping from Susan. I think we had a third topic lined up to talk about automation, and that was around forecasting and budgeting. So I’m going to play another role, Jeff. Let’s say I am an engineering manager and I’ve got an R&D project going on for my company, and I have a budget. It’s the second half of 2022, and there are a lot of eyes on the budget. How can you help me keep track of my budget so that I don’t have to face the wrath of finance?
Jeff Harris:
Yeah. So, I mean, one of the nice things is that because we have this set up in a hierarchical way, we can assign management roles to maybe the R&D branch, right? To a particular VP who’s managing that. Within that, they would be able to do a couple of things. One, they can come in and create sort of a sub-group. Here, we see some dev projects going on right now. We see that we don’t have budgets set on these, but it’s very simple to come in and say, “Hey, for that anomaly detection AI dev project, I’m going to come in and set a budget on this.”
Once I’ve set that budget, I’m also able to do a top-down and bottom-up budgeting approach, right? From a top-level view, I can look at the different budgets that are set for the company as a whole and see if those align. From the bottom-up view, as well, I’m saying I’ve got $1.3 million, but if I’ve got people setting budgets at the teams below me, we can automatically reconcile those.
So, just as a quick example here, let’s say that my budget was actually only $500,000 for September. Well, I would very quickly see, “Hey, there’s a problem here.” You’re going to need to reconcile this. Either up your budget at the company level or go talk to your teams and see where you might be able to cut. The nice thing is, you can see what those budgets are, how that’s trended over time, and where people are over or under. You might be able to recoup some budget as well.
So imagine you’re coming in, you’re going to create a new node for that project where you already have one, and you can set the budget at that level. The next piece is, how do I get alerted on it? We have the ability to send alerts either to an email address or to Slack. Any sort of distribution list or messaging notification system you have, and we can alert you on the forecast when we forecast that you’re going to go over budget, as well as when you’ve gone over budget.
So, not just after something’s happened, but ideally, let’s say there’s an anomaly that’s happened, and that anomaly kicked up your forecast, and now we forecast you’re going to go over budget. You get two alerts: one that says there was an anomaly and another that says we think you’re going to go over budget this month. Maybe there’s something you can come in and take some action to reduce that possibility.
Anu Gardiner:
Excellent. Getting alerted and, as you said, triangulating it from two sides, now I can get the team together and catch it before it becomes a problem. So I think getting ahead of that curve would be helpful. Alright, done with role play. Susan, back to you for Q&A. Let’s open this up and see what’s on people’s minds.
Susan Brandes:
Yeah, I mean, I have some questions that people emailed me, but I’m happy to hear from our group here first before we get to those. Does anybody have any last-minute questions for us?
Viewing Breakdown of AWS Cost by Service Items
Audience Member:
I do. I wanted to see the breakdown of the cost by the AWS service items. Is there a way we can drill down to that level?
Jeff Harris:
Yeah, absolutely. So happy to show a few things here as well. Going into the cost analytics, again, this is much more the exploratory “I want to understand cost.” Each of these widgets is breaking down your total cost based on where you are in this hierarchy by some attribute. One of those attributes, obviously, is service. So I can see this breakdown here at the company level.
One of the other interesting things you can do because of the way this whole system works together is, let’s say I want to see my EC2 cost for the company, and I’m curious about what business units are driving that EC2 cost. As I filter onto EC2, it adds that filter up here, and then each of these widgets will update to reflect that. I can see not just the different services that we’re using, but also who’s using that service the most and what teams are driving that cost. Does that get to the answer to your question about service-based breakdown and how you’re able to drill into that?
Audience Member:
So in the EC2 story, is the compute, data, storage cost combined into one, or do we have it further broken down by those components?
Jeff Harris:
There is a further breakdown, yeah. We look at the service type and get into a couple of categories. So ones that you’re probably familiar with from AWS directly: you’ll see storage, which is kind of these EBS volumes, load balancer network charges, instance cost. Another one here, container runtime, is a concept that Yotascale has. So if you are using ECS or EKS or any sort of Kubernetes, you can connect those clusters to Yotascale, and we’ll identify those instances as container runtime costs. This is another further breakout of your particular EC2 cost.
Audience Member:
And I believe the last question on this from my side would be, do you have a feature to break down the CloudWatch logs by the log group level?
Jeff Harris:
So we can reference—let me just kind of show this here. There’s not a specific capability that I would point to and say, “Yeah, this is exactly what that does,” but I think what would solve that is the ability to reference the resource ID or some other piece of metadata about those CloudWatch logs. So I could filter down to CloudWatch, see the actual log resource ID, and parse that and filter it based on that, or allocate it based on that. Or maybe at the tag level if I have those log groups tagged.
Audience Member:
Alright, OK, that would serve the purpose because that’s one of the use cases I have today. But the tool I’m using is not able to help me with that, so I wanted to see that.
Jeff Harris:
Yeah.
Anu Gardiner:
Yep.
Audience Member:
OK. Thank you.
Anu Gardiner:
Of course.
Cost Visibility for All Kubernetes Flavors
Jeff Harris:
No problem. Questions? Just briefly touching on some of that container stuff as well because we didn’t get too far into it. We do connect to any flavor of Kubernetes that you’re running, even ECS on the AWS side and then AKS on Azure, GKE on GCP. As we drill into these different ones, we actually get a further breakdown.
So I mentioned we can break this down and see cost by namespace, cost by cluster, cost by deployment. We get into this capacity utilization concept where we’re identifying the amount of dollars you’re spending on the cluster overall, but breaking that into how much of that capacity is actually being reserved by a pod, how much capacity is not being reserved by a pod and just sitting there idle, and then even further within particular applications that are reserving capacity, how much of it is being used and how much of it is not. This allows teams to identify places where they have over-reserved capacity and then work to right-size even the pod requests. That’s where we have found some value in the utilization data within Kubernetes.
Audience Member:
Is it further broken down at the task definition level?
Jeff Harris:
The task for ECS, yeah. We can see the task definitions as well and use those tasks. You can actually allocate based on the task.
Audience Member:
And do we have to define any kind of rules for how we want to break down that cost from cluster to the task? Because it would be a fair amount of CPU and memory that each task is using.
Jeff Harris:
Yes, the way we look at it is we allocate the amount that the task is requesting. It’ll get allocated back to that task, and then you can take an attribute about the task, like the task name or some other tag related to it, and be able to allocate that to a particular team within this hierarchy, along with RDS, S3, any other cost there might be, and see all that grouped together.
Audience Member:
OK. Thank you.
Jeff Harris:
Yeah.
Relevant and Responsive Recommendations and Alerts
Susan Brandes:
Hey Jeff, I got a question about the recommendations. They’re using a different tool and they keep getting kind of the same recommendations over and over, or they’re not really relevant to them. How do we address that situation?
Jeff Harris:
Yeah. So that’s something we hear commonly as well. Our approach to this is to allow the engineers to organize the recommendations in a way that allows you to parse through them logically based on the different applications or teams that there might be. It’s not uncommon to find some large recommendation. We talked about this one actually where it’s $2000 savings per month. As I drill into this and look at what these resources are, maybe I find, “Oh, I know what this RDS database is and those two are out there for a very particular reason. I’m going to keep them around.” I can go ahead and hide them and say, “Yep, indefinitely hiding them or keeping them hidden for 90 days because that’s how long I think it’s going to be.”
And then even within this, I can see the comment history for the recommendation, right? So we’re able to have this back and forth and understand why a decision was made about a particular recommendation.
Susan Brandes:
And so finance people can go and look at those comments and review them?
Jeff Harris:
Yeah, we do see some finance people do that. Actually, the more commonplace that I see finance and engineering communicating is really around the anomalies. Same concept within an anomaly: an engineer reviews that anomaly and they say, “Well, yeah, we released and we spun up a new cluster. There’s a business need for that. So is this a cost anomaly or not? By the data, yeah, it is. But by my understanding of what we’re doing, I’m not going to consider this an anomaly.” That engineer has the ability to provide that feedback, add comments, and this feedback goes into our algorithms for future anomaly detection and forecasting. This feedback can be really helpful to improving the data that you’re getting out of the system as well.
Role Based Access to Cost Data
Susan Brandes:
Yeah. And then along those same lines, I got a question about the role-based access and making sure people only see what they need to see.
Jeff Harris:
Yeah. How does that work? We have the ability to create pretty granular user management in Yotascale. We really built this product with enterprises in mind, so we can define our own roles. By default, we have some Yotascale roles: global admin, global read-only, local read-only, local admin. Basically, we can create our own roles based on our own permission sets. We can also create groups and assign different access levels to the users that are part of those groups. In this case, we can say you get access to your particular branch of the tree and below to edit, or you can get read access to the total company. Sometimes we work with enterprises that are really siloed and don’t want to share information—maybe it’s subsidiaries, whatever it might be. You can use the RBAC system to assign access at a pretty granular level as well.
Susan Brandes:
OK. I’m going to pause. Any other questions coming to mind? No? OK, we’re coming up on the hour. I think I’ll just wrap it up. Thank you, Jeff, Anu, and Pedro for being here, and everyone else for attending. You all have my email address, so feel free to email me if you have any questions or just want to chat again. We’re happy to hold another session too if you’re interested. And I think we will just say adieu for now.
Jeff Harris:
Thank you all. Appreciate the time. Thanks, Susan.
Anu Gardiner:
Thanks.