Read the case study: Optimizing Cloud Costs and Forecasting Accuracy at ClickUp

Overcoming the Challenges of Kubernetes Cost Allocation and Reporting

Kubernetes is a powerful tool for building and deploying sophisticated applications and scaling those applications to meet business needs. Being able to scale an application’s resources up or down is key to making a cloud environment cost-effective, but the features that make Kubernetes powerful and flexible also complicate tracking and budgeting costs.

Kubernetes orchestrates many application and infrastructure components, and containerized applications can automatically request resources within set policy limits without involving IT Operations. While this greatly simplifies the job of on-demand application scaling, it can escalate costs unexpectedly.

That raises the question of who pays the bill for these shared cloud resources? Without costs allocated directly to their department, users may treat these resources as free. This situation inevitably leads to inefficient use, unpleasant surprises, and ineffective budgeting. Cost accounting issues are especially acute when organizations distribute their applications, as is typical in Amazon Web Services (AWS) and other environments.

The best way to gain control and institute responsible use of AWS resources is to provide visibility to cost and utilization. When teams see their resource use, they can better understand and control their cloud spending. However, there are some barriers to allocating costs effectively.

First, modern infrastructure architecture is dynamic, and the ownership and responsibility for the containers and Kubernetes running on that architecture are transient. In many cases, even the applications are a shared resource, with many parts of the organization scaling them up and down simultaneously. Several employees are responsible for this resource use, yet allocating cost requires knowing who uses what resources when.

To further complicate this accounting, corporations generally do not link cloud spending to the corporate accounting hierarchy. This condition requires implementing both a method for monitoring the costs and reporting as well as a method for charging the appropriate budget.

However, the same dynamics that make Kubernetes so attractive removes engineering from the cost management workflow. While engineering can implement policies to control costs by limiting what and how much of a resource to allow access to, they have difficulty monitoring real time usage. This lack of information makes it challenging for engineering to determine the true resources required to do the job. Justifying and implementing exceptions becomes tenuous.

Shared cloud infrastructure is complicated and makes costs challenging to allocate. However, how do you create a solution that captures costs and makes them visible to the owners, enabling business decisions? What’s the best way to gain adequate visibility into cloud resource use with Kubernetes?

The answer is to allocate resource costs to the business units, products, and the development and test teams that are using them. In this whitepaper, we will explore and offer a solution to this challenge.

Kubernetes Infrastructure Components

A Kubernetes cluster is a set of virtual or physical machines on network nodes. They are the architecture’s worker machines. To understand the cost of this shared environment, first use the features in Kubernetes to create a cost structure that mirrors your organization’s needs.

You can track costs at the cluster level when using Amazon’s Elastic Kubernetes Service (EKS), but this can be expensive. Kubernetes provides several additional ways to create a cost infrastructure. At a lower level, you can track namespaces, pods, deployments, labels, and tags.

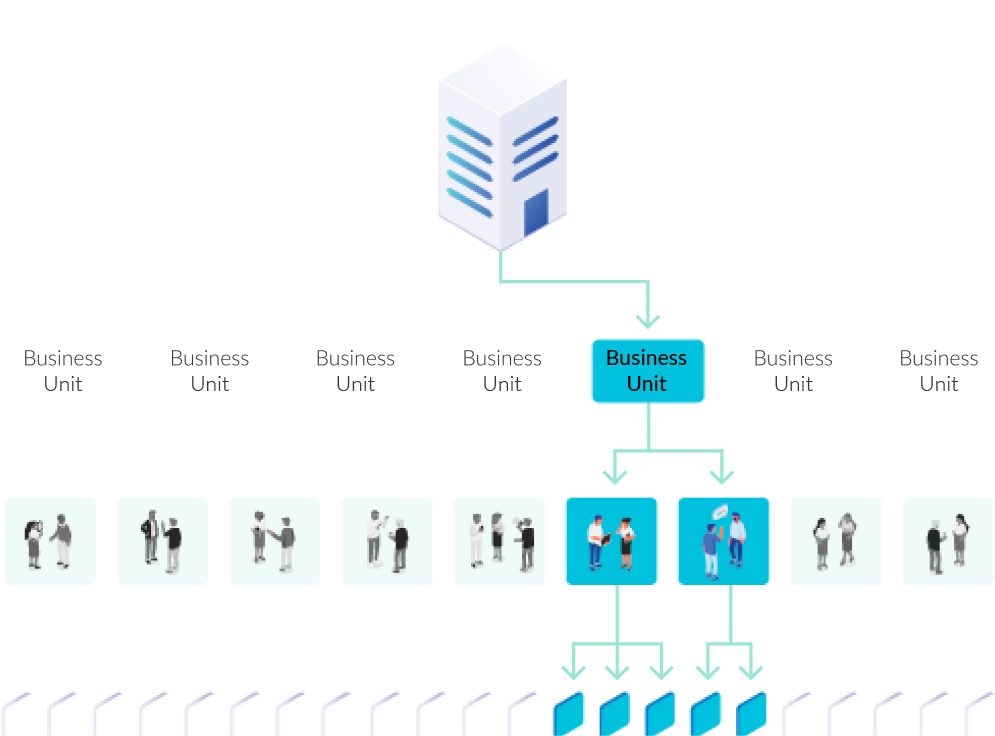
A namespace enables you to create multiple virtual clusters within the same physical cluster. This enables users on different teams to access the same physical environment. While you could place each team into different clusters, this may be more costly in volume pricing. A namespace enables you to balance the need for separation with economies of scale.

A pod is a set of containers running on your cluster. A pod is the smallest unit of workload processing that you can deploy to a node. A pod’s containers may be related to each other or not. A Kubernetes deployment creates or modifies pod instances. Deployments scale the number of replica pods, update code, or roll back earlier deployments.

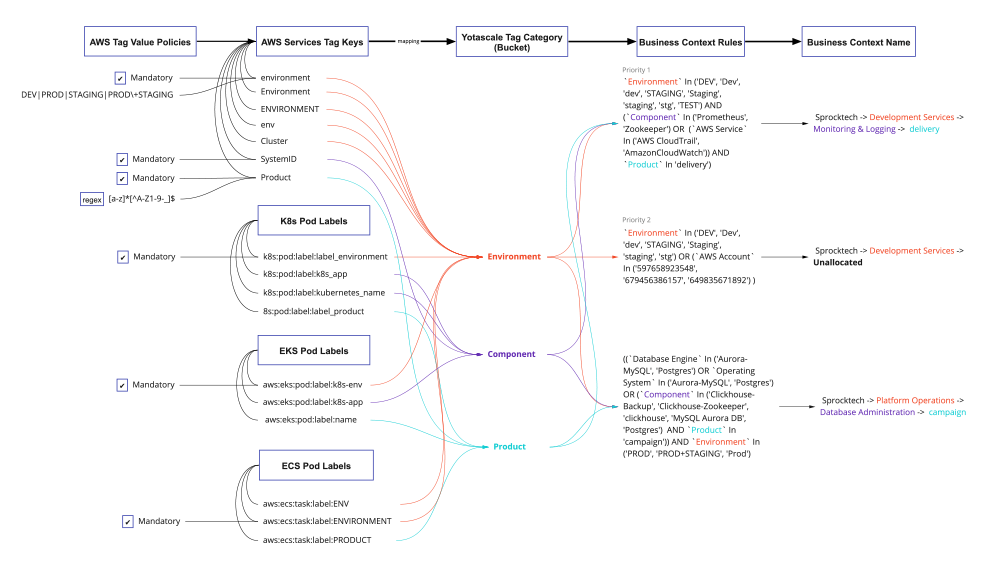
Labels are key-value pairs attached to objects within Kubernetes. They specify attributes that are meaningful to users. Labels help you understand the structure or use of objects from a user’s point of view, and they enable you to select and operate on a Kubernetes object. They map parts of the system to an organization’s structure or group or aggregate the parts by level.

Tags provide an even lower level of granularity. These are user-defined key-value pairs for multiple technical and business needs, such as cost allocation, technical tracking, and security.

While Kubernetes provides resource tracking through these objects, it is up to the organization to structure, tune, and monitor them to create a helpful allocation system.

Major Questions in Monitoring Costs

The more obvious its meaning, the more valuable the tag is for analytics.

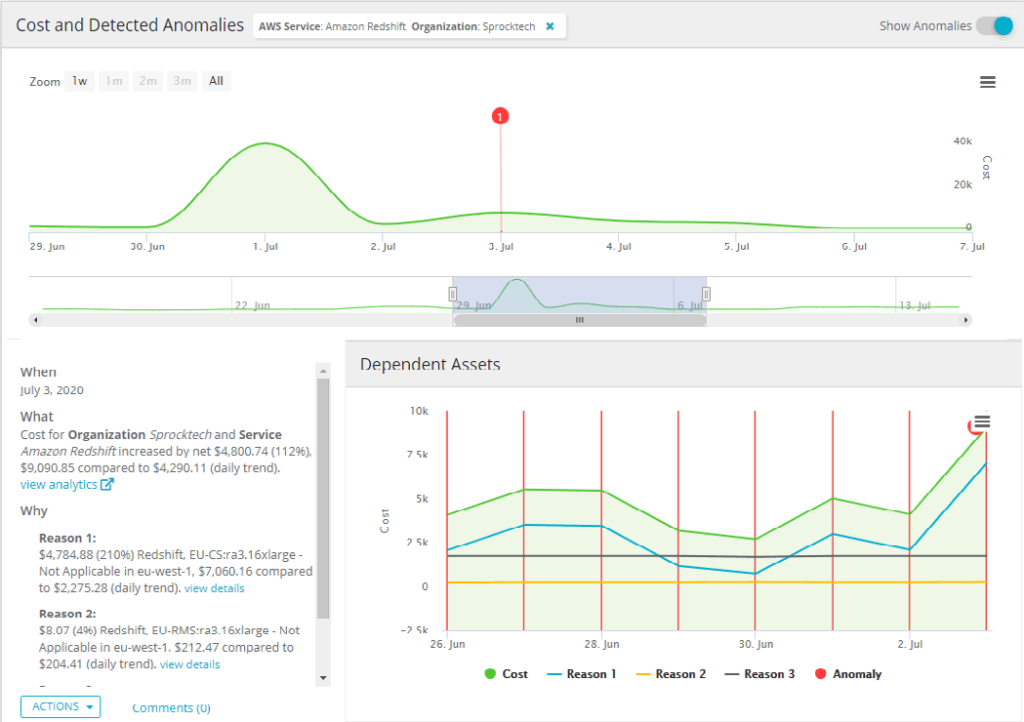
Cost analysis and control are essential financial functions, but a typical cloud deployment is like a black box to the finance department. While finance can run monthly reports to get the deployment cost, they don’t know what causes these trends. IT Operations must tie the individual cloud deployment instances to separate groups or users for finance to get helpful information.

While namespaces, pods, and deployments provide some granularity, they often don’t mirror the organization’s functional cost structure. Further complicating the matter is that subdivisions like namespace, pods, deployments, and labels primarily assist information technology operations. So, the business has only a limited ability to manipulate these designations for cost allocation. Tags offer the flexibility an organization needs to structure information so it can control spending.

Tags are metadata attached to resources or groups of resources. For example, you can add tags to a virtual machine (VM) to designate its function (development, test, or production). You can also attach an additional tag to the same VM to assign it to project or organization relationships. This flexibility enables you to create the structure you need to mirror your organizational needs. Costs are then associated with these tags, driving various analytics to understand and control these costs.

Organizations often make the mistake of allowing each department or team to implement their own tagging processes. Standardize and automate tag structures across the organization to get the most significant benefit from their analytics.

This process starts with developing naming standards for tags. Remember that tags can be anything that helps understand resource allocation within a business unit, the team, the application using it, or its function.

Organizing and Aggregating Resource Costs

Although there are many options for using tags, the figure above provides a way of organizing and aggregating resource costs. This enables the organization to view expenses by resources at the company, business unit, team, or application level. You can also add a cost center into the hierarchy if it makes sense for your organization.

Depending on how you want to analyze your data, you can add tags representing functions (development, test, and production) or customers that the application supports. Suppose a particular set of resources helps a customer, set of customers, or product. In that case, you can designate the cloud expenses associated with the entity as a contribution to the cost of goods sold or support chargebacks.

Similarly, expenses related to research and development may have tax implications, so you may want to identify these separately. The analytics you decide to use to identify and manage costs should determine the tags you use.

Tag Automation

One purpose of a cloud environment, and Kubernetes in particular, is to support flexibility. To keep track of costs, creating tags must keep pace with this flexibility. Tools like Yotascale automatically tag resources based on policies set by engineering when Kubernetes and containers are automatically created. Manual tagging is slow and prone to errors, and it also requires people to understand the complexities of tagging policies and inheritance to produce the correct tags supporting analytics. Automation removes human error, delay, and cost from the equation.

Yotascale enables a business to define its tag policy. The software can then implement this tag policy by scanning resources to look for missing tags, duplicate names, or tags that violate naming conventions and report compliance. You can manually remediate any inconsistencies or develop policies to automate this remediation.

One example of automating a policy is tagging through inheritance. In scanning the environment, we might discover resources that don’t have tags. Yotascale fixes this problem by finding out if the resource’s parent has a tag and allows the untagged resource to inherit its parent’s tag properties.

Yotascale automates your tagging by providing the capability to:

Define tagging policies

Report on compliance

Remediate inconsistency

Automate remediation

Kubernetes Orchestration
Kubernetes orchestrates many application and infrastructure components, and containerized applications can automatically request resources within set policy limits without involving IT Operations. While tThis greatly simplifies the job of on-demand application scaling, it can escalate costs unexpectedly.

While it might be easy to select resources and assign parent tags to them, this manual task takes time your team could be using for other projects. Once you remediate manually, you can establish a policy that automatically tags a newly added resource with the parent resource tags, preventing a missing tag from happening again. Yotascale then automatically issues an API call to AWS and updates AWS on your behalf. Since you do not maintain tags locally, AWS continues to be the single source of truth. While this is a simple example, consider more complicated tagging rules, such as assigning a customer cost for chargebacks. Yotascale enables you to establish policies for chargebacks then assign tags automatically to resources meeting the criteria.

Yotascale’s ability to scan your environment, identify violations, and develop new policies to automate their remediation provides continuous tagging automation. For more information on tagging automation, see the video AWS Tag Management for Cost Allocation.

Analyzing and Controlling Cost

Establishing a tagging framework identifies resource cost at the granularity necessary to properly analyze, allocate, and control costs in a way that fits the way you do business.

Yotascale Contexts provides complete cost visibility and distributes cost according to the organizational hierarchy you created. Using the Contexts view, Yotascale distributes real-time cost details to the teams that can act. Organizations often ask how their costs change over time and what amount their cloud resources need for the next cycle.

The figure below provides a company summary of costs and their breakdown by function, such as data ingestion, infrastructure, and productivity, over time. The company can view the information at a high level or drill down into the organizational structure.

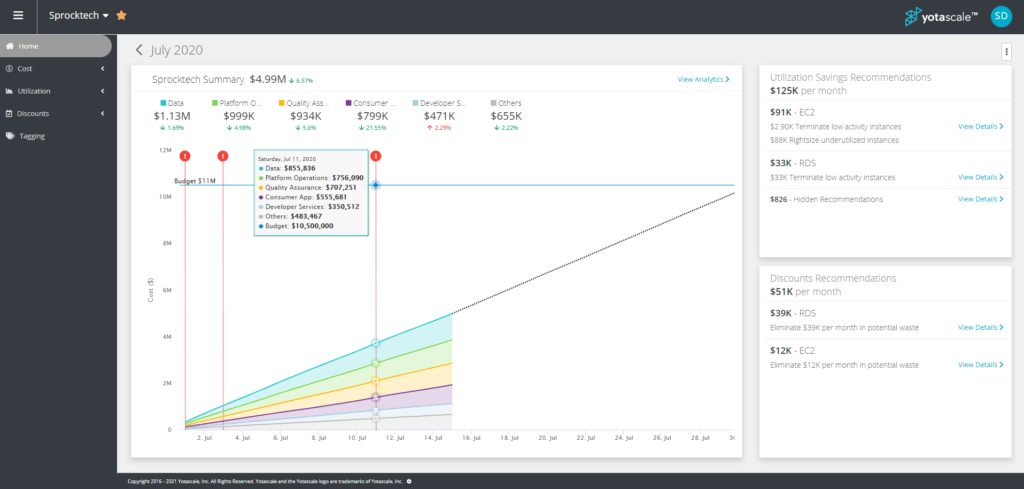
Yotascale analyzes these statistics and makes cost and utilization recommendations based on that analysis. In this case, Yotascale recommended terminating underused Amazon Elastic Compute Cloud (EC2) and Relational Database Service (RDS) resources. It also recommended curtailing resource reservations to be consistent with their use. Users can drill down either by organizations or by recommendations to get a clear picture of use or why Yotascale made its recommendations. All the expected features, such as changing timeframe or organization views, are available.

Allocating costs for multi-tenant containers can be challenging. Yotascale handles this cost allocation challenge by showing key values within a cluster using namespaces or containers to fairly distribute both use and reservation costs. This feature is essential in customer chargebacks.

Together, the ability to granularly decompose multi-tenant cluster costs and Yotascale’s Contexts feature provide fine-grained, per-team usage costs. Combine the Contexts view with prices for traditional cloud infrastructures, like software instances, databases, and a network, for a complete picture of each team’s infrastructure expenses. Assigning costs back to teams provides both the information and motivation for them to control their Kubernetes costs.

Kubernetes enables various teams to have independent operations. Rather than requesting resources and waiting for approval by a central information technology decision-maker, with Kubernetes’ ability to scale up or down, organizations can be nimble and productive.

An unfortunate by-product of this independence is many people adding to the cost of AWS resources. Also, because of the large number of players, it’s challenging to predict how costs will compare to the budget at the end of any period.

Actions by many individuals introduce variability, making it more challenging to decide on simple predictive methods. Yotascale’s budgeting and forecasting functions use machine learning to send near real-time alerts on potential budget overages to the individuals responsible. These alerts enable individuals to focus on potential problem areas and adjust their use rather than getting an ugly surprise at the end of the month.

Detecting Anomalies

A single person’s actions might have a significant effect on Kubernetes’ spending. Whether they forget to shut down a cluster, reserve too much capacity, or fail to correctly limit autoscaling features, many individual or systemic errors can waste Kubernetes’ spending.

These problems can be highly localized, time sensitive, and sporadic, making it challenging to detect them in time to take corrective action. For example, take a Kubernetes set to scale up to high limits, even if there isn’t any real reason to do so. There may be no problem until, for various reasons, such as a denial-of-service (DoS) attack or application error, use rises sharply. To control costs, you must alert the responsible parties to act without denying the customer service level you want. Additionally, you want to be able to learn and adjust your Kubernetes specifications to prevent future incidents.

After you set up Yotascale with the appropriate cost attribution structure and regularly monitor the analytics, the next step in controlling cost is implementing real-time anomaly detection and notification.

Anomaly detection

Within Kubernetes, there may be thousands of logs, health checks, and metrics for all your Kubernetes clusters. You cannot manually check everything. Yotascale provides you with a workflow, analytics, and real-time alerts to detect, solve, and act on these anomalies based on your cost usage data.

Using statistical analytics, Yotascale can detect cost and usage anomalies that fall outside of normal usage patterns. This triggers an automated alert to the responsible engineers Slack, Microsoft Teams, or email so that the anomaly can be immediately reviewed and actioned.

Detailed information about what workloads and instances are causing the anomaly, as well as why they triggered the anomaly are provided, preventing days or weeks of investigation into the source of a cost anomaly. Engineers can take immediate action, or if the cause is known and expected, dismiss the alert with resolution information.

Next Steps

Kubernetes cost management starts with a clear tagging policy that allocates costs to match the company’s organizational structure, projects, or applications. Automating ongoing tagging policies ensures that your teams have the best cost visibility into your Kubernetes clusters over time. More importantly, choosing a tool that provides end-to-end visibility of all your cloud workloads is critical to managing all your cloud spend.

Tools like Yotascale provide you with end-toend capabilities to monitor and control your Kubernetes costs, as well as your cloudenabled workloads.

If your Kubernetes spending is out of control or if you think it is not, breaking down your spending and tracking it over time can help you pinpoint cost-saving opportunities.

Copyright © 2022 Yotascale, Inc. All Rights Reserved. Yotascale and the Yotascale logo are trademarks of Yotascale, Inc.

Recommended for you